This section explores the characteristics of West Vancouver’s households and housing supply, including types, costs, affordability, accessibility and development trends. These insights help guide housing policy, land use planning, and community amenities.
Families and Households
-
Diverse household types (i.e., multiple-family households, lone-parent family households, and non-family households) have become more common, increasing by 8% in the last twenty years. More than half of West Vancouver's households (54%) do not have children living at home.
Image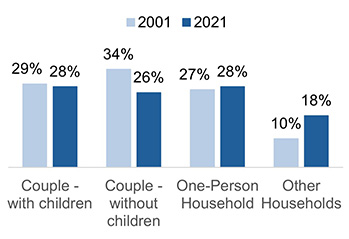
Figure: Households by type, West Vancouver, 2001 - 2021 Census
-
A majority (62%) of West Vancouver’s housing consists of family-sized homes of three or more bedrooms, primarily in single-detached houses. The District has a higher proportion of homes with four or more bedrooms and fewer one- and two-bedroom homes compared to the region, where house size distribution is more balanced. With an average household size of 2.5 people, many homes in West Vancouver likely have “unused” bedrooms.
Image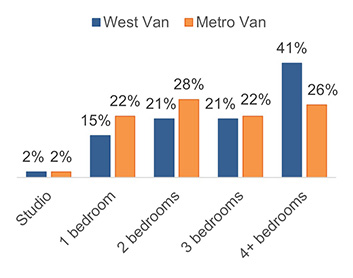
Figure: House size by bedroom count, West Vancouver and Metro Vancouver, 2021 Census
Housing Stock
-
In 2021, West Vancouver had 17,690 occupied private dwellings, with nearly two-thirds being single-detached homes – meaning there has been little change in overall housing composition. For example, over the past two decades, ground-oriented housing (i.e., multiplex and row/townhomes) has increased by an average of only seven units per year.
Image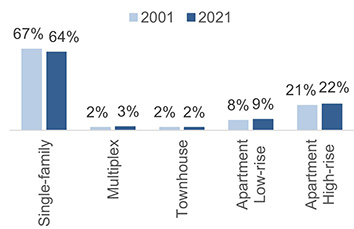
Figure: Structure type of occupied private dwellings, West Vancouver, 2001 - 2021 Census (multiplex refers of duplex, triplex and other -plexes housing types. Other housing types such as movable dwellings are not included due to negligible rounding)
-
While West Vancouver’s housing stock has increased by 9% and remained relatively static in the past two decades, the regional housing stock has grown by 40% and become more diverse. The region has seen a shift from single-family dwellings to more multifamily housing. Townhomes now make up 10% of the regional housing stock, versus 2% in West Vancouver.
Image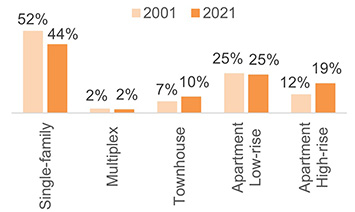
Figure: Structure type of occupied private dwellings, Metro Vancouver, 2001 – 2021 Census
-
More than half of West Vancouver’s homes were built before 1981, and the last three decades have seen slower construction rates than the region. Notably, over 80% of the purpose-built rental stock was built before 19801. By contrast, the region’s housing is younger and more evenly spread with roughly one-third of housing under 25 years old, one-third between 25-45 years old, and one-third over 45 years old.
Image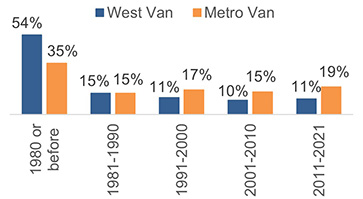
Figure: Period of construction of occupied private dwellings, West Vancouver and Metro Vancouver, 2021 Census
12023 BC Assessment. This percentage excludes seniors’ rental housing and supportive housing.
Household Affordability
-
In 2021, 71% of West Vancouver residents owned their homes. The proportion of renter households has increased by 5% over the last two decades, possibly due to older residents downsizing to rental properties to reduce maintenance demands or younger residents facing affordability challenges in homeownership (or a combination of both).
Image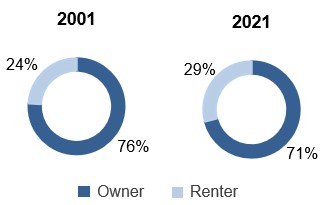
Figure: Household distribution by tenure, West Vancouver, 2001 - 2021 Census
-
Housing is considered unaffordable if it costs more than 30% of a household’s before-tax income. In 2021, one third of owner households and over half of renter households in West Vancouver fell below this affordability standard. Aggregately, this represents 39% of all West Vancouver households experiencing affordability challenges, compared to 29% regionally.
Image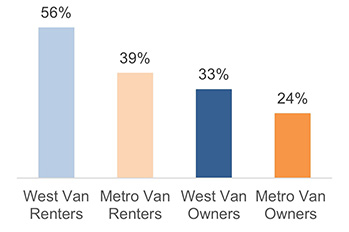
Figure: Households spending ≥ 30% of income on housing by tenure, West Vancouver and Metro Vancouver, 2021 Census
Housing Affordability
-
Housing costs have risen faster than incomes. While incomes increased by 38% over the past 20 years, single-family home prices grew by 400%, and rents by 180%. Multifamily housing has remained a relatively more affordable ownership option. The affordability gap may be linked to demographic trends, with fewer younger residents and families compared to 2001 and compared to the region today.
Image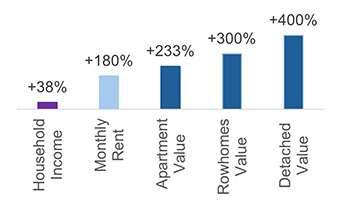
Figure: Median historical growth trends in income and housing costs by dwelling type and tenure, West Vancouver, 2001 – 2021 Census
-
West Vancouver’s median household income is $104,000, higher than the regional median of $90,000. High-income households earning over $200,000 make up 26% of households, twice the regional 13%. Meanwhile, lower-income households earning under $45,000 represent the next largest income group in West Vancouver (21%). This means a smaller portion of middle-income households live in West Vancouver, as seen in the “dip” on the graph.
Image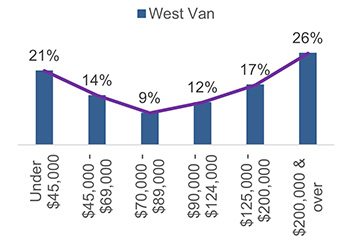 Image
Image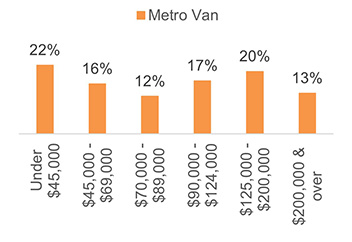
Figure: Households by income, West Vancouver and Metro Vancouver, 2021 Census (2021 census reports annual incomes for the 2020 calendar year)
Owners and Ownership Housing
-
More than half (56%) of West Vancouver homeowners live mortgage-free, compared to 41% regionally.
Image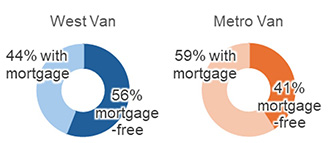
Figure: Mortgage-free living, West Vancouver and Metro Vancouver, 2021 Census
-
Between 2013 and 20231, the price per square foot of single-family homes and condos increased by 62% and 83%, respectively. While macro-economic events influenced home prices in recent years, they have returned to pre-pandemic levels and stabilized, possibly a result of the higher-interest rate environment. In 2023, detached homes averaged $1,361 per square foot, while condos averaged $1,284.
Image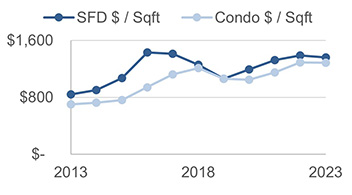
Figure: Average price per square foot for single-family (SFD) and condos, West Vancouver, 2013 – 2023 BC Assessment
1Based on assessed value and home size from BC Assessment. Ten-year history from 2013 – 2023 from BC Assessment.
-
From 2011 to 2021, median household income rose by 23% (from ~$84,000 to $104,000)1, while median home values increased by 92% (from ~$1.3M to ~$2.5M). As a result, the home value-to-income ratio grew from 15 to 24. By comparison, the regional ratio increased from 8 to 12, highlighting a more prominent affordability gap in West Vancouver.
Image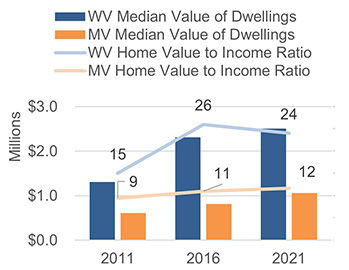
Figure: Ratio of median home value to median household income, West Vancouver and Metro Vancouver, 2011 – 2021 Census
1A ten-year history (2011 – 2021) is reported due to data limitation and inconsistencies in prior Census years.
Renters and Rental Housing
-
In 2021, West Vancouver had 5,150 renter households, most of whom lived in apartments and single-family homes. In 2023, there were roughly 2,100 purpose-built market rental housing units, meaning that more than half of renters relied on the secondary rental stock such as secondary suites and rented condos1. Nearly half of West Vancouver’s renters live in single-family homes, compared to under 30% regionally, where most renters live in multifamily housing which is usually located closer to shops, transit, and employment.
Image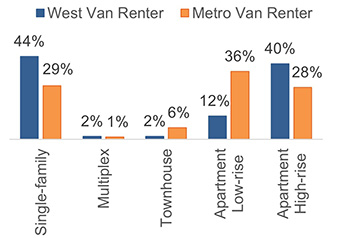
Figure: Household distribution by rental tenure, West Vancouver and Metro Vancouver, 2021 Census
12023 BC Assessment
-
Both West Vancouver and the broader region have consistently low purpose-built rental vacancy rates, indicating a tight rental market that makes securing rental housing challenging. A balanced rental market has a vacancy rate of 3%-5%1, but over the past 20 years West Vancouver has averaged 0.9%2 and the region has averaged 1.3%.
Image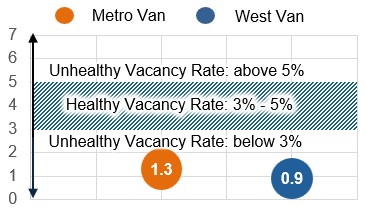
Figure: Average vacancy rates, West Vancouver and Metro Vancouver, 2004 - 2024 CMHC
1BC Ministry of Housing, Guidelines for Housing Needs Reports: Technical Guidelines
2CMHC Rental Market Survey – Average Historical Vacancy Rate for West Vancouver and Metro Vancouver -
West Vancouver’s renters face higher monthly housing costs than owner households. In contrast, regional homeowners typically pay more in monthly shelter costs than renters. This suggests that West Vancouver’s restricted rental market places financial pressure on renters compared to both local homeowners and regional renters.
Image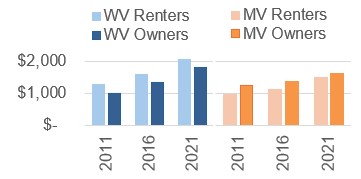
Figure: Median monthly shelter costs by tenure, West Vancouver and Metro Vancouver, Census 2011 - 2021 (historical trend is based on a ten-year timeline from 2011 – 2021 due to inconsistent census data for previous years)
Core Housing Needs
-
A household is in core housing need if its housing falls below at least one of the adequacy, suitability, or affordability standards set by Statistics Canada, and would have to spend 30% or more of its total before-tax income to access acceptable housing1. In 2021, 31% of renter households and 10% of owner households in West Vancouver met this definition. Renters in West Vancouver are more likely to experience core housing need than both local homeowners and regional renters. Approximately half of our renters in core housing need face extreme core housing need and would have to spend 50% or more of their total before-tax income on acceptable housing, including 2% of owner households.
Image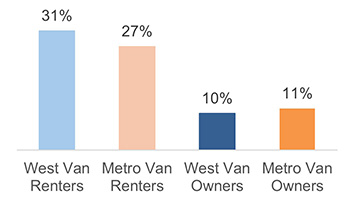
Figure: Percentage of households in core housing need by tenure, West Vancouver and Metro Vancouver, 2021 Census
1Housing standards are defined as follows: Adequate housing is reported by their residents as not requiring any major repairs; Affordable housing has shelter costs equal to less than 30% of total before-tax income; Suitable housing has enough bedrooms for the size and composition of resident households according to the National Occupancy Standards (NOS). Acceptable housing (meets all three housing standards).
-
The demand for subsidized housing has grown across the region, with BC Housing’s waitlist increasing by 80% regionally and 75% in West Vancouver since 20161. In West Vancouver, 10% of renter households receive a housing subsidy, a proportion similar to the region (11%). West Vancouver has ~4,000 households earning less than $45,000 and only 800 subsidized housing units2 – 98% of which are dedicated to seniors.
Image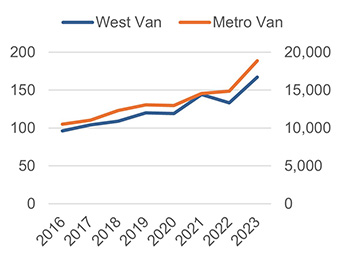
Figure: Households on BC Social Housing waitlist, West Vancouver and Metro Vancouver, 2016 – 2023 BC Housing
1Metro Vancouver Housing Data Book 2023 – BC Housing
22023 BC Assessment
Seniors and Accessible Housing
-
Senior citizens are the majority demographic in West Vancouver, representing almost 1 in 3 residents. Currently, there are around 1,400 beds/units1 dedicated to seniors, including independent and assisted care at various affordability levels. Our seniors’ population grew by 3,500 residents in the last two decades, while 280 beds were lost due to the closures of West Vancouver and Capilano Care Centres.
Image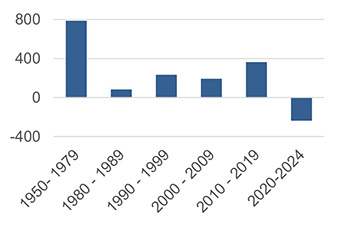
Figure: Dedicated seniors’ care accommodations by construction period, West Vancouver, 2023 BC Assessment
1Count includes all housing units/beds geared for seniors across West Vancouver and across all affordability levels.
-
Universal and adaptable interior design features accommodate residents with varying or changing needs. Currently, one in four West Vancouver residents report experiencing a health and activity limitation that affects their ability to participate in daily activities1. Nearly 75% of these individuals are 50 years or older and the number of residents with disabilities is expected to increase as our population ages. The BC Building Code was updated in 2025 to require all new large condominium and apartment buildings to provide 100% adaptable suites2.
Image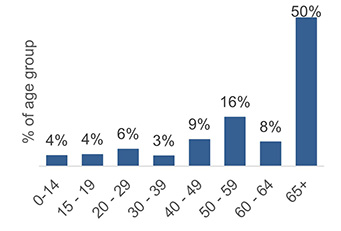
Figure: Age group profile of individuals with health and activity limitations, West Vancouver, 2016 Census
1Social Planning and Research Centre BC. Customized data set Census 2016. Census data from 2021 not yet available.
2BC Building Codes & Standards, Accessibility.